
The Most Popular Ice Pop Brand and Flavor in Every U.S. State

Few summer treats feel as instantly nostalgic as an ice pop, or Popsicle. They bring back memories of backyard barbecues, pool days, neighborhood ice cream trucks, and those moments when something cold and sweet makes a hot afternoon a little easier.
Beyond their summertime nostalgia, ice pops also have a place in care settings.
In hospitals and recovery rooms, they can offer a small source of comfort because they are cold, familiar, and often easy for patients to tolerate.
Using Google Trends search data from the past 12 months, we identified the most searched ice pop brand and the most searched ice pop flavor in every U.S. state and the District of Columbia. The results reveal a mix of classic favorites, regional loyalties, and a few unexpected standouts.
The Most Popular Ice Pop Brand in Every U.S. State
When it comes to ice pop brands, America appears to love a classic. Bomb Pop takes the top spot overall, ranking first in 15 states. Its reach is especially strong across the Midwest and Plains, where it leads in states like Iowa, Illinois, Indiana, Kansas, Minnesota, Missouri, Nebraska, North Dakota, and South Dakota.

Close behind is GoodPop, which finishes first in 14 places. Unlike Bomb Pop’s heavier concentration in the middle of the country, GoodPop’s wins are spread widely across the map, from California and Oregon to Florida, New York, Pennsylvania, and Vermont. That makes it one of the most geographically versatile brands in the data.
Otter Pops ranks third with 11 first-place finishes and shows particular strength in the West, including Alaska, Arizona, Hawaii, Idaho, Nevada, Utah, and Wyoming. Outshine Fruit Bars follows with eight wins, many of them in the East and South. Together, Bomb Pop, GoodPop, Otter Pops, and Outshine account for 48 of the 51 first-place finishes in the dataset, meaning just four brands dominate nearly the entire map.
A few of the biggest surprises come from the brands that barely broke through. Popsicle ice pops, despite being one of the most recognizable names in the category and often used to encompass any frozen treat, comes out on top in only two places: Michigan and New Jersey. Fla-Vor-Ice earns just one first-place finish, in Arkansas. Even in a category built on familiarity, regional preferences clearly shape which brands people are searching for most.
Favorite Brands, State by State
| State | Most Popular Brand | State | Most Popular Brand | |
| Alabama | GoodPop | Montana | Otter Pops | |
| Alaska | Otter Pops | Nebraska | Bomb Pop | |
| Arizona | Otter Pops | Nevada | Otter Pops | |
| Arkansas | Fla-Vor-Ice | New Hampshire | Bomb Pop | |
| California | GoodPop | New Jersey | Popsicle Ice Pops | |
| Colorado | GoodPop | New Mexico | Otter Pops | |
| Connecticut | GoodPop | New York | GoodPop | |
| Delaware | Bomb Pop | North Carolina | GoodPop | |
| District of Columbia | Bomb Pop | North Dakota | Bomb Pop | |
| Florida | GoodPop | Ohio | Outshine Fruit Bars | |
| Georgia | Outshine Fruit Bars | Oklahoma | Bomb Pop | |
| Hawaii | Otter Pops | Oregon | GoodPop | |
| Idaho | Otter Pops | Pennsylvania | GoodPop | |
| Illinois | Bomb Pop | Rhode Island | Outshine Fruit Bars | |
| Indiana | Bomb Pop | South Carolina | Outshine Fruit Bars | |
| Iowa | Bomb Pop | South Dakota | Bomb Pop | |
| Kansas | Bomb Pop | Tennessee | GoodPop | |
| Kentucky | Outshine Fruit Bars | Texas | GoodPop | |
| Louisiana | GoodPop | Utah | Otter Pops | |
| Maine | Bomb Pop | Vermont | GoodPop | |
| Maryland | Outshine Fruit Bars | Virginia | Otter Pops | |
| Massachusetts | GoodPop | Washington | Outshine Fruit Bars | |
| Michigan | Popsicle Ice Pops | West Virginia | Bomb Pop | |
| Minnesota | Bomb Pop | Wisconsin | Otter Pops | |
| Mississippi | Outshine Fruit Bars | Wyoming | Otter Pops | |
| Missouri | Bomb Pop |
The Most Popular Ice Pop Flavor in Every U.S. State
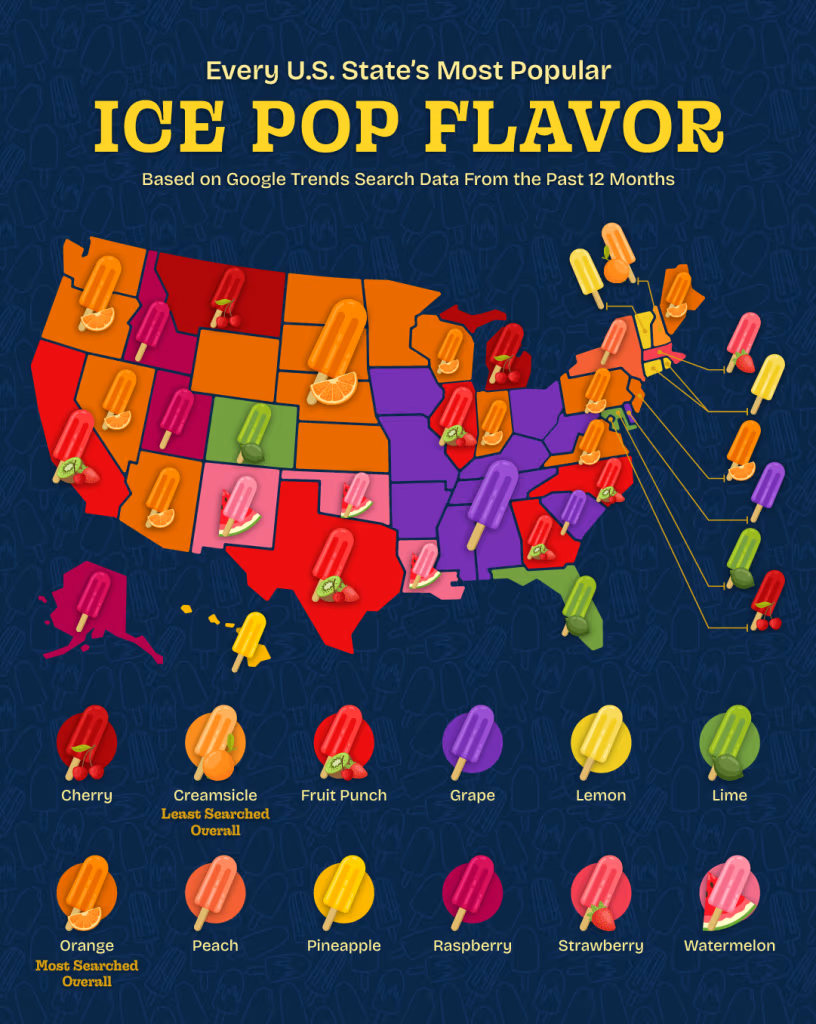
Flavor tells an even brighter story, and one classic stands above the rest. Orange is the most searched ice pop flavor overall, finishing first in 16 places. It also leads the Midwest and the West, giving it the widest reach of any flavor in the dataset.
Grape lands in second place with 11 first-place finishes and a clear stronghold in the South. It leads in Alabama, Arkansas, Kentucky, Mississippi, South Carolina, Tennessee, and West Virginia, while also winning in Delaware, Iowa, Missouri, and Ohio. Between Orange and Grape alone, more than half of all places in the study share the same top flavor.
After those two, the field opens up considerably. Fruit punch ranks third with five first-place finishes in several large states: California, Georgia, Illinois, North Carolina, and Texas.
Beyond that, the results show fun regional variation. Watermelon is the favorite in Louisiana, New Mexico, and Oklahoma. Lime leads in Colorado, Florida, and Maryland. Lemon wins in Connecticut, Rhode Island, and Vermont, and Raspberry wins in Alaska, Idaho, and Utah. Cherry is favored in Washington, D.C., Michigan, and Montana. Single-state outliers include Pineapple in Hawaii, Strawberry in Massachusetts, Peach in New York, and Creamsicle in New Hampshire. These differences prove that while some favorites are nationwide, local flavors still thrive.
Favorite Flavors, State by State
| State | Most Popular Flavor | State | Most Popular Flavor | |
| Alabama | Grape | Montana | Cherry | |
| Alaska | Raspberry | Nebraska | Orange | |
| Arizona | Orange | Nevada | Orange | |
| Arkansas | Grape | New Hampshire | Creamsicle | |
| California | Fruit punch | New Jersey | Orange | |
| Colorado | Lime | New Mexico | Watermelon | |
| Connecticut | Lemon | New York | Peach | |
| Delaware | Grape | North Carolina | Fruit punch | |
| District of Columbia | Cherry | North Dakota | Orange | |
| Florida | Lime | Ohio | Grape | |
| Georgia | Fruit punch | Oklahoma | Watermelon | |
| Hawaii | Pineapple | Oregon | Orange | |
| Idaho | Raspberry | Pennsylvania | Orange | |
| Illinois | Fruit punch | Rhode Island | Lemon | |
| Indiana | Orange | South Carolina | Grape | |
| Iowa | Grape | South Dakota | Orange | |
| Kansas | Orange | Tennessee | Grape | |
| Kentucky | Grape | Texas | Fruit punch | |
| Louisiana | Watermelon | Utah | Raspberry | |
| Maine | Orange | Vermont | Lemon | |
| Maryland | Lime | Virginia | Orange | |
| Massachusetts | Strawberry | Washington | Orange | |
| Michigan | Cherry | West Virginia | Grape | |
| Minnesota | Orange | Wisconsin | Orange | |
| Mississippi | Grape | Wyoming | Orange | |
| Missouri | Grape |
Closing Thoughts
Ice pops and Popsicles may be a simple summer favorite, but to us, they also reflect something deeper: comfort, familiarity, and care. The results of this study show that people across the country have strong loyalties regarding their favorite frozen treats, whether that means a classic brand, a fruity flavor, or a nostalgic pick that brings back childhood memories.
At Madonna University, that connection matters. In nursing, care is not only about clinical skill. It is also about the small acts that help patients feel safe, supported, and seen. Something as simple as an ice pop can offer hydration, soothe discomfort, and make a stressful moment feel a little more manageable.

If you are interested in a nursing education rooted in compassion, service, and patient-centered care, explore Madonna University’s Accelerated Bachelor of Science in Nursing (ABSN) program in Metro Detroit. You could be eligible to earn your nursing degree in as few as 16 months if you have a non-nursing bachelor’s degree or at least 60 college credits from an accredited university.
Methodology
To identify the most searched ice pop brand in each U.S. state, we began by compiling a list of eight widely recognized and popular ice pop brands. Using Google Trends data from the past 12 months, we analyzed relative search interest for each brand across all 50 states and the District of Columbia. Based on this analysis, we determined the top-searched brand within each state, as well as the overall most-searched brands nationwide.
To identify the most-searched ice pop flavor in each U.S. state, we followed the same process using a list of 15 widely recognized and popular ice pop flavors. We analyzed relative search interest over the past 12 months and identified the top-searched flavor in each state, along with the overall most-searched flavors.
Google Trends assigns search terms a value from 0 to 100 based on relative popularity within a given region and timeframe. A score of 100 represents peak search interest for that term. These values reflect relative search interest, not raw search volume. For this study, we used high search interest as a proxy for popularity.
Fair Use
You are welcome to use, reference, and share non-commercial excerpts of this study with proper attribution. If you cite or cover our findings, please link back to this page so readers can view the full methodology, charts, and context.